


 Steve Neemeh
Understanding an ASIL in the Functional Safety Standard ISO 26262
Understanding an ASIL in the Functional Safety Standard ISO 26262

Functional safety encompasses how we plan for, design, develop, and manage the creation of safe products that can also lead to hazardous conditions if they malfunction. Achieving functional safety requires the application of standards, processes, and other key elements. These have been developed to guide manufacturers towards creating functionally safe products and systems. Safety analysis, high-level requirements, technical requirements on a product… these all need to be clarified and achieved on a particular system to make sure that faults don't propagate and create a hazardous condition.
Within this functional safety ecosystem, safety goals are the top-level safety requirements that are assigned to a system with the purpose of reducing the risk of one or more hazardous events. They are derived from a thorough understanding of all the potential hazards that may factor into the failure of a component or system. Risks are identified and assessed, and then safety goals are developed to address these risks. Each safety goal is analyzed to identify under what conditions it must be applied, thus applying a ranking system to the goals.
As part of the risk classification scheme defined by international standard ISO 26262 “Road vehicles – Functional safety”, each safety goal is assigned an Automotive Safety Integrity Level (ASIL) attribute, as well as all the requirements for returning the vehicle to a safe state. The ASIL level communicates the risk classification. This classification quantifies the ranking and makes it easier for engineers to ensure proper coverage and prioritize their work when comparing one risk to another.
When determining the ASIL rating of a safety goal, there are three main factors that are taken into consideration:
Of these three factors, probability may come across as the most daunting to quantify. At first blush, it may seem that you are being asked to account for almost every conceivable hardware failure scenario, in every conceivable combination, and then trying to calculate the odds of finding yourself in that scenario. And that analysis is not restricted to just the humans inside the vehicle, but also encompasses those persons in the surrounding environment, such as cyclists and pedestrians. The mathematics can seem overwhelming at first. And yet, it can be done once you understand what it is that you are actually being asked to do.
The calculation of the probability of failure is an essential component in reducing the probability of undesired events. These calculations must be performed using rigorous parameters of trustworthy origin. Thankfully, the standards aid in this endeavor by providing reference tables, mathematical formulas, methodical processes, and well-defined boundaries in which to work. With the assistance of these resources, the probability of a dangerous failure per hour, or the probability of a dangerous failure on request of a safety function, can be calculated in a straightforward manner. You are not being asked to boil the ocean, but you are being asked to pay attention to detail.
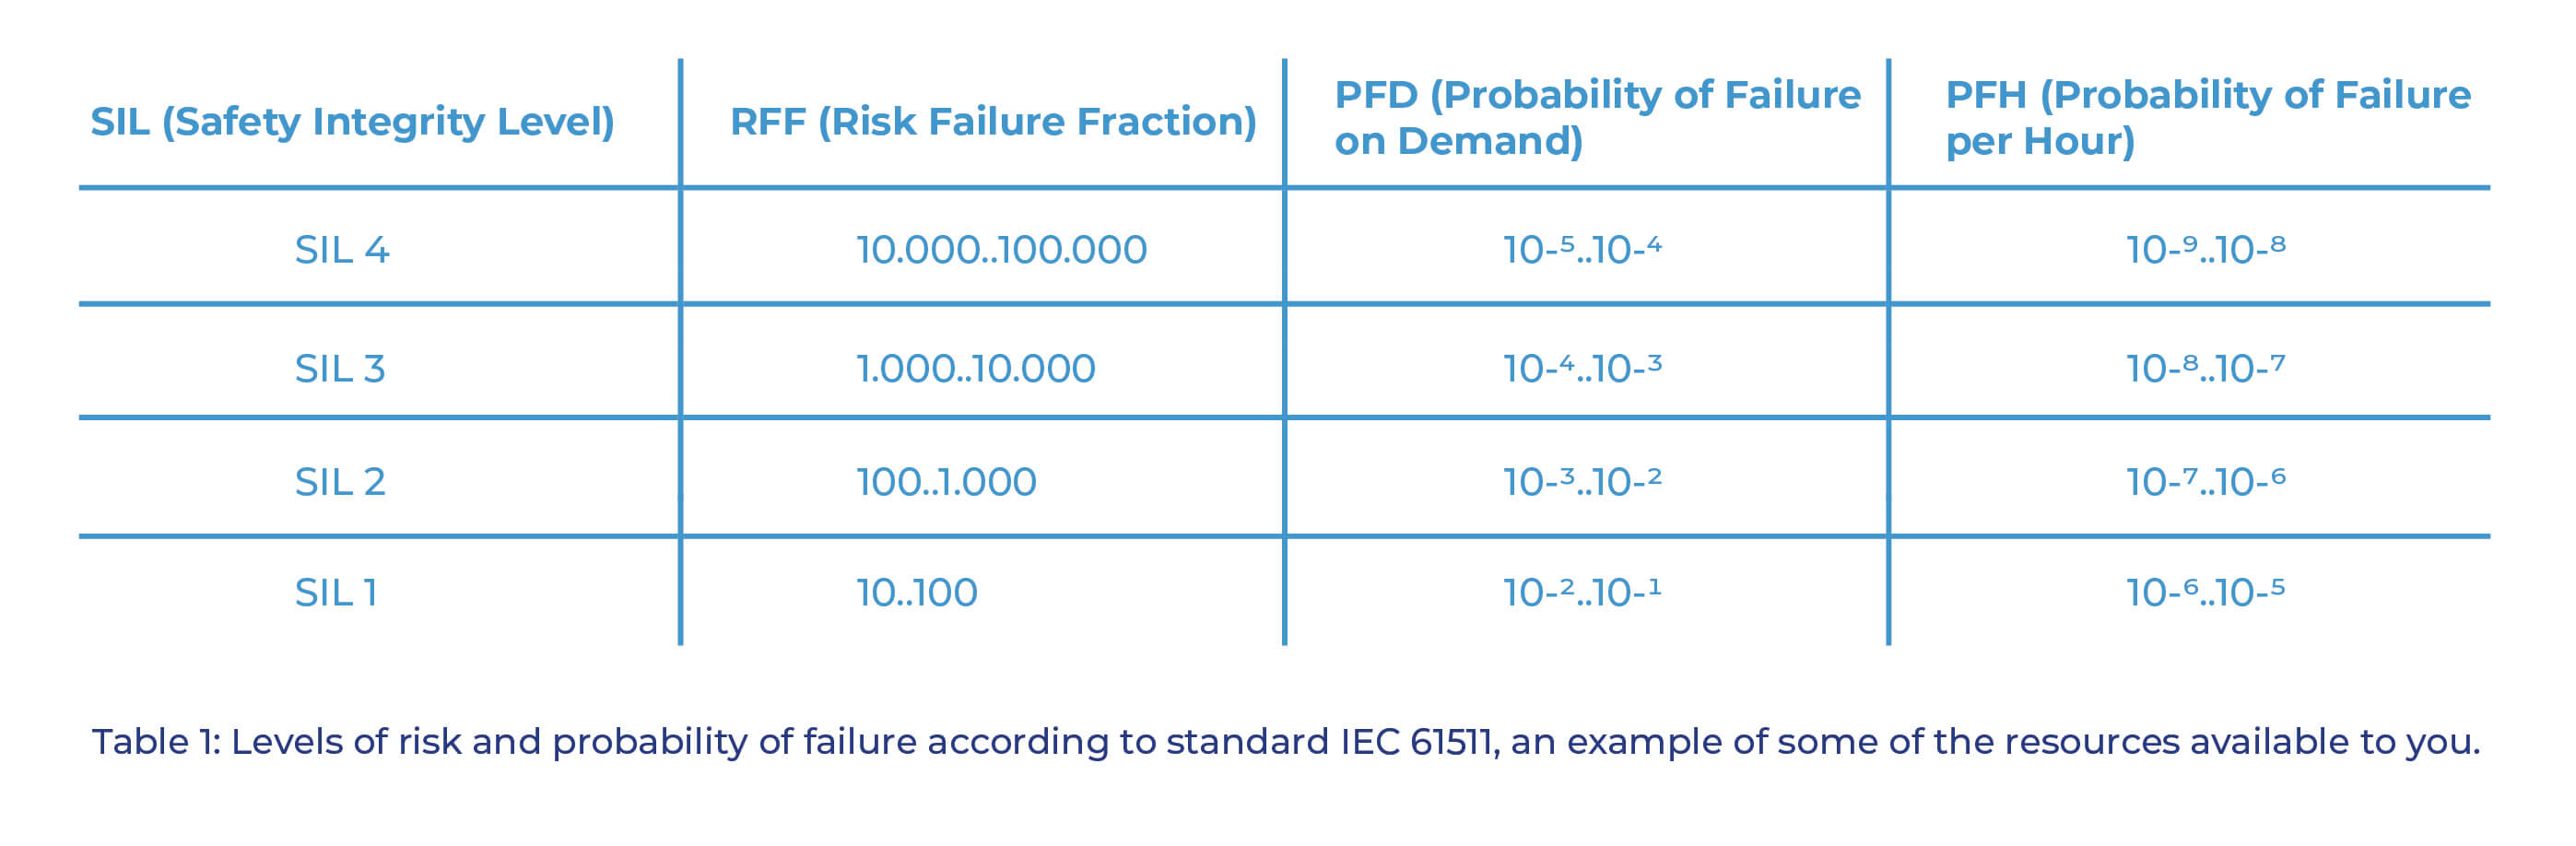
The standard does not require the use of any specific tools to perform SIL verification calculations; they can be calculated manually, or you can use a spreadsheet. It is much more important that the concepts be handled properly, that the correct parameters be selected, and that complete formulas be used.
It is hard to predict the probability that a specific hardware failure will happen. That's not something that is assessed in the beginning. When we refer to “probability,” we are typically referring to the probability of a person being placed in a scenario where a fault may occur and have a particular kind of consequence. Probability includes things like the surrounding environment, more so than the product itself. What's the probability that I am going to be on a freeway? What is the probability that I am going to be on that same freeway in the rain or in the snow? What is the probability that I am going to be on a country road or a two-lane highway? These are the probabilities that we value because when you're included in that scenario, that's a real-world, relatable starting point from which to start assessing.
Picture that the act of testing starts like you are a driver acting in a movie. First, you get put into a scenario that is defined in the script. “This is the environment.” It all starts with defining the scene. Next, you wait for the failure and see what happens. Because if there is nobody around you, if you are in a nice, empty parking lot when there are no other cars around, you can throw many kinds of failures into the test. The typical driver is okay with that; they can handle a variety of failures if they occur in a parking lot. However, if that same driver is placed in a freeway scenario and there are a lot of cars around, and the other drivers are driving very fast adjacent to you, then it creates more of a risk. It is a different scene, a different scenario. The probabilities are going to be different, so they need to be calculated, and the ASIL level needs to be assessed for each scenario.
When analyzing faults, it is important to understand the difference between systematic faults and accidental faults. Systematic faults are failures caused by defects that occur during the design and development phase of a component or system. Accidental failures are more difficult to anticipate and manage, and they can occur without warning.
The probability of an occurrence also comes into play. This is accomplished by referencing the failure rate. The probability of failure of a component increases steadily over time. If the data indicate that the failure rate is consistent, components showing premature wear or failure should not be considered.

Company A runs through this entire process, and they have determined that they have created a functionally safe product. Meanwhile, their competitor, Company B, also goes through the entire process, and they also claim to have a functionally safe product. To what degree can this become an apples-to-apples comparison? How do you define the safety goals at the beginning when two different companies are defining two different safety goals? How much company-to-company comparison can be performed? Can you end up with two different concepts of what “functionally safe” is, based on factors like probability?
The short answer is yes. There are typically different approaches to the same set of compliance. Generally, there is never really a one-to-one match; you are unlikely to have the exact same safety goals. But there are a lot of commonalities for the mature, understood systems, and within them, a greater likelihood of similar approaches.
Where we should start raising some eyebrows is if there are two very similar systems, and one company categorizes their system as ASIL A, and the other company categorizes their system as ASIL D. If you see a big difference in the ratings, that should raise a concern.
What is typically found is that maybe one company rates an ASIL as B, and another company rates it as C, or vice versa. A difference of one rating, an adjacent rating. This lesser deviation is easily accounted for. There is a lot of subjectivity in this process, and one company might be more conservative than the other. When you need to make a choice, for example, between being more conservative versus more like the way it has been done in the past… those kinds of choices are part of everyday life, and that's just general human behavior. So, for most of the safety goals, when they deviate by only one or two ratings, that is considered typical.
This has not yet been seen in the United States, but internationally, in German OEMs, they often have a committee. A lot of the German OEMs have gotten together for at least one of their systems, the propulsion system, and effectively said, “We all have similar types of products. We have a lot of the same suppliers. So, why wouldn't we give them the same safety goals for the same type of product?” They formed a committee, and they defined their own standards. “Okay, let's take this type of system, let's give it a safety goal with this rating, and this is the overall general concept of how we want them to address it from a technical perspective.” That consistency can be very beneficial.
Commercial trucks are built to exact specifications defined by their projected use case, including engines, gear ratios in the drive trains, braking systems, and weight control measures such as aluminum wheels or lightweight frames. There is no such thing as a “generic” commercial truck, and trucks may not be interchangeable from one use case to another. For example, a powerful commercial truck built for efficient running at maximum weight across the steep washboard profile of Interstate 80 from Cleveland to New York might be overpowered and uneconomical for running light loads across the plains.
When autonomous technologies advance to the point where we're seeing more of them out on the road, there is still going to be a significant amount of variation, even though these different products have gone through similar functional safety processes. You could have one type of 80,000-pound autonomous commercial vehicle, and a different type of 80,000-pound autonomous commercial vehicle, and they could both react very differently to the same road conditions based on aerodynamics, center of gravity, load distribution across the axles (which typically varies from load to load), load distribution on the trailer, and so many other variables.
Every brand and model offered will have available hundreds of variations on each basic design. How do you add these additional layers of complexity and still make the practical achievement of functional safety a reality? Will this variation force manufacturers to become more common in the products they produce? Or, is this process going to have to mature to the point where the process itself can accommodate all these subtle variations? This is where some of the most significant challenges are happening in autonomy right now, a realm where possibility and probability are sometimes difficult to distinguish from one another, as the capabilities of modern technologies redefine what can be done.
The process of ISO 26262 is certainly something that can be followed. We want our systems to be deterministic, meaning we should always know how a system is going to behave under specific conditions. If you give two similar systems the same conditions, they should behave the same way, all the time. That's true of legacy-type systems, where they are designed and developed in a very structured manner with known repeatable software. The problem with newer systems is that they are not developed like that. To push the technology where we're going, the software engineers can't write their code that way.
For example, on an autonomous system, those are systems that are trained, not programmed. In a functionally safe autonomous vehicle, nobody programs into the software, “The way you detect the stop sign is that you look for an octagonal red shape with the word STOP on it.” That would be a very predetermined program, narrowly defined, and limited in scope to only the conditions that the programmer anticipated. Autonomous systems are not programmed like that.

Instead, that's the kind of information that autonomous systems are taught. They are shown different elements of different stop signs until they learn, “Okay, that's a stop sign. And my behavior is when I get to something like this, I come to a stop.” Learning, not programming, with the capacity to learn things that may not have been anticipated. That’s how an autonomous vehicle knows to not only stop at a stop sign on a post seven feet in the air, but also knows to stop when a similar sign is being hand-carried by a school crossing guard who just walked into its path.
And so, getting into those types of systems where we don't program them, but instead they are learning all by themselves, takes the determinism away a little bit, which is what we rely on for ISO 26262. And so, the dilemma becomes, how can you follow the ISO 26262 process on a system that is teaching itself? We are teaching the autonomous systems how to learn, and now it is doing its own learning. How do we control that? How do we ensure that it's safe? That's the current challenge at hand for us as a safety company.
Functional safety is achieved when every safety function is defined and implemented at the level of performance that the function requires. Identifying, defining, and categorizing the hazards and conditions are only part of the challenge. It is not enough to just define what must happen. The probability of occurrence for each scenario is a critical component in building a complete picture of the safety of a product or system. In this endeavor, attention to detail in the gathering of data and the performance of calculations is of utmost importance. And there is plenty of work to be done.

What is functional safety management in automotive
How are safety goals developed for functional safety management

Understanding an ASIL in the Functional Safety Standard ISO 26262

ASIL-D safety cases: where the discipline diverges from ASIL-B and below Key takeaways An ASIL-D safety case is not a deeper ASIL-B safety case....

What is Tailoring in Functional Safety? The international standard that governs functional safety is ISO 26262-2:2018, “Road vehicles — Functional...

How are Safety Goals Developed for Functional Safety Management?
What auditors look for in an ISO 26262 safety case Key takeaways The ISO 26262 safety case is now assessed as a structured argument rather than a...

If you purchase prebuilt (Automotive) Safety Integrity Level – ISO 26262/IEC 61508 or other – packages, what kind of guarantees do you need from the...